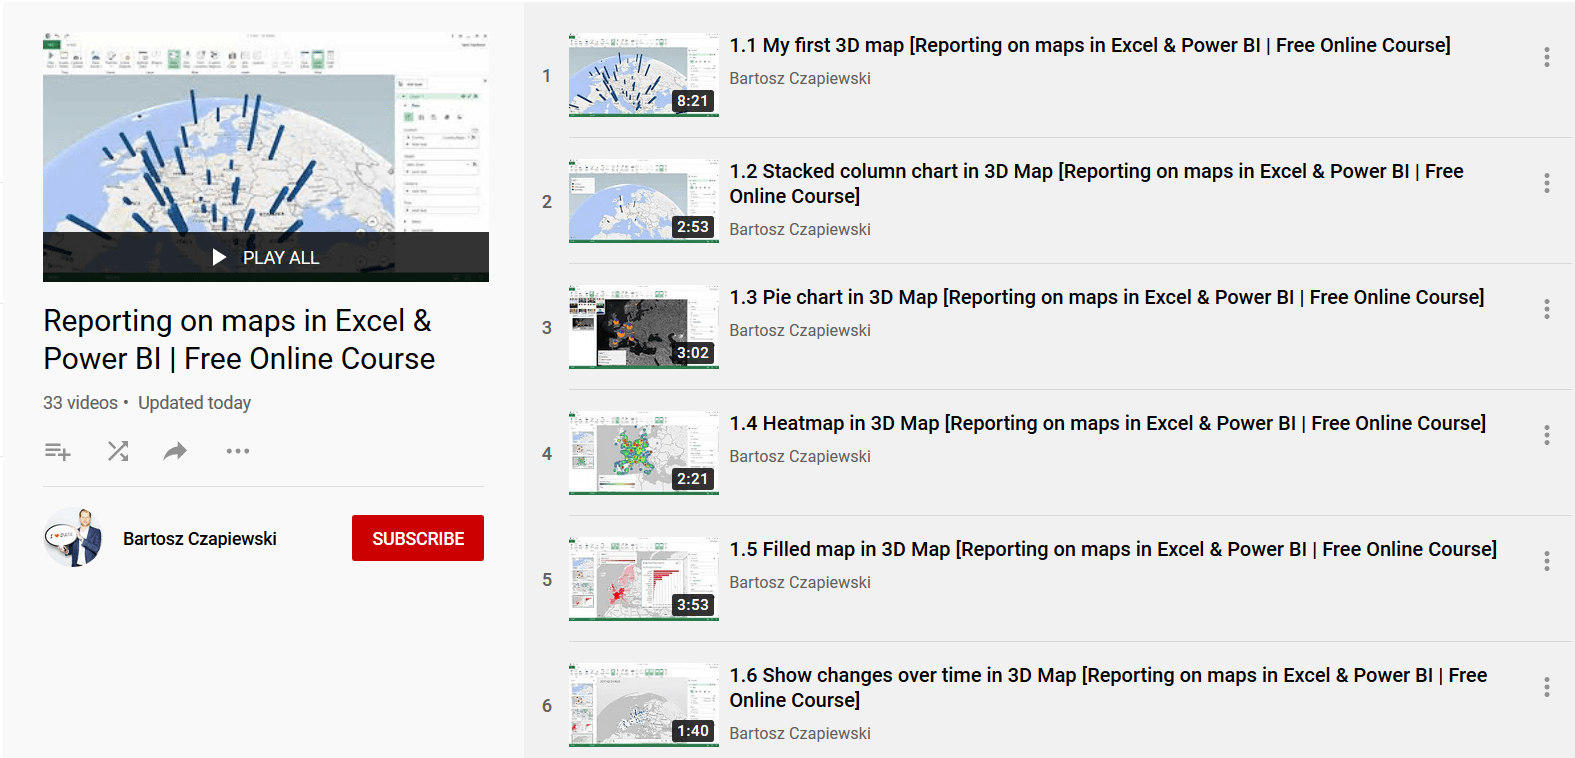
← Tutorial archiveExcel & Power BI tutorial1.2. Stacked column chart in 3D Map [Reporting on maps in Excel & Power BI | Free Online Course]By Bartosz Czapiewski · Published 2020-09-01 ReportiReporting on maps in Excel & Power BI – Free Online Course Lesson 1. Power Map 3D 1.2. Stacked column chart in 3D Map 1.2 Stacked column chart in 3D Map [Reporting on maps in Excel & Power BI | Free Online Course]Load video from YouTubeLoading the video connects your browser to YouTube. YouTube may store data on your device.Watch on YouTube instead ← All tutorials