
If you are trying to analyze what is going on in your logistics, you might need the flow map that will show where your distribution centers are and where you send your products to. With Excel Map it’s really easy to customize a map like this to show with arrows the direction of your flow.
Prepare the data for the Excel flow map
We are starting with two tables: the first one is the current position of our logistics centers, the second one shows where to deliver our goods from this centers.

Draw a simple bubble chart
Then we use post code assigning to build a simple bubble chart – just copy & paste your post codes and values into the ZIP sheet. Next click Assign.

Your data will land in the G column of the Data sheet. You can now copy it and paste into the H sheet – responsible for bubble chart.
 Then go to the Map sheet and turn on the Bubble chart.

Create a flow map based on Excel’s bubble chart
Now is the tricky part. You need to create a copy of current bubble chart and paste it on top of it. Then right click the top one and change the chart type to Scatter with straight lines.

At the beginning it will look strange because it is connected to all data points in the Data sheet. But we want to connect it to a different data source.
Before we move on you need to modify the ship-to table:
- Use VLOOKUP to find the Longitude and Latitude for your ship-to post codes.

- Copy & paste your ship-from cells and assign to them Longitude and Latitude.

- Copy & paste just the ID column & ship from cells to create a dummy table of the same size

- Sort the whole table by ID column

You should end up with a table like this:

Now let’s go back to the copy of our bubble chart and edit the series values for a series called “Wartosc” to cover our new table.

You can also turn off the legend for that chart.

Finally you format the data series to have some begin arrow type.

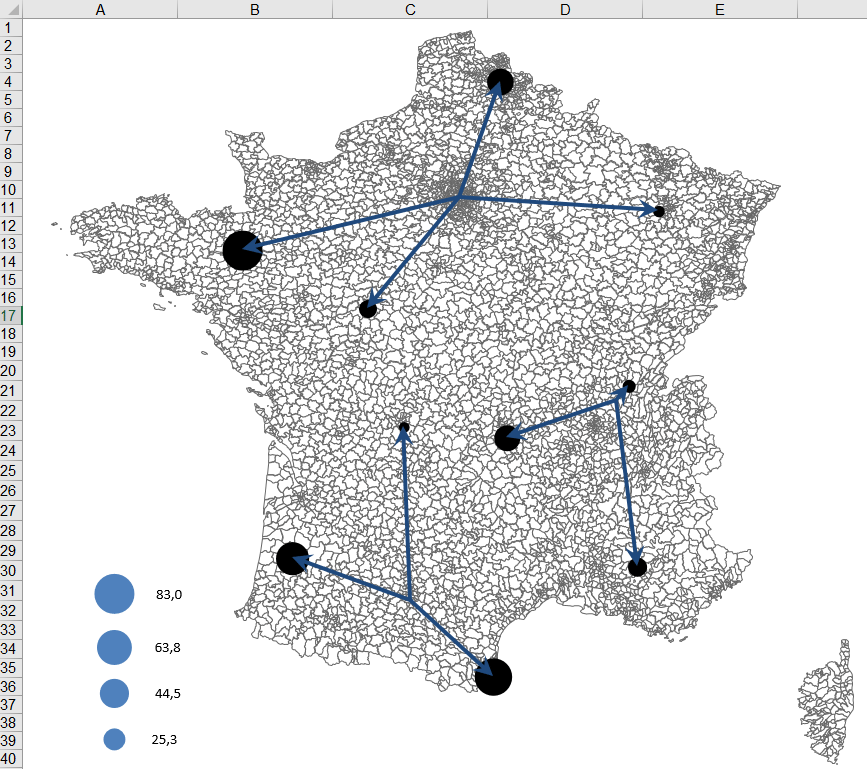
The final map could like this:
Watch the video tutorial to learn how to use the Excel Map
How to design a flow map for logistics with Excel Map?
Loading the video connects your browser to YouTube. YouTube may store data on your device.
Watch on YouTube instead