
How to create a statistics map for Europe NUTS levels 0-1-2-3 with Excel NUTS Map?
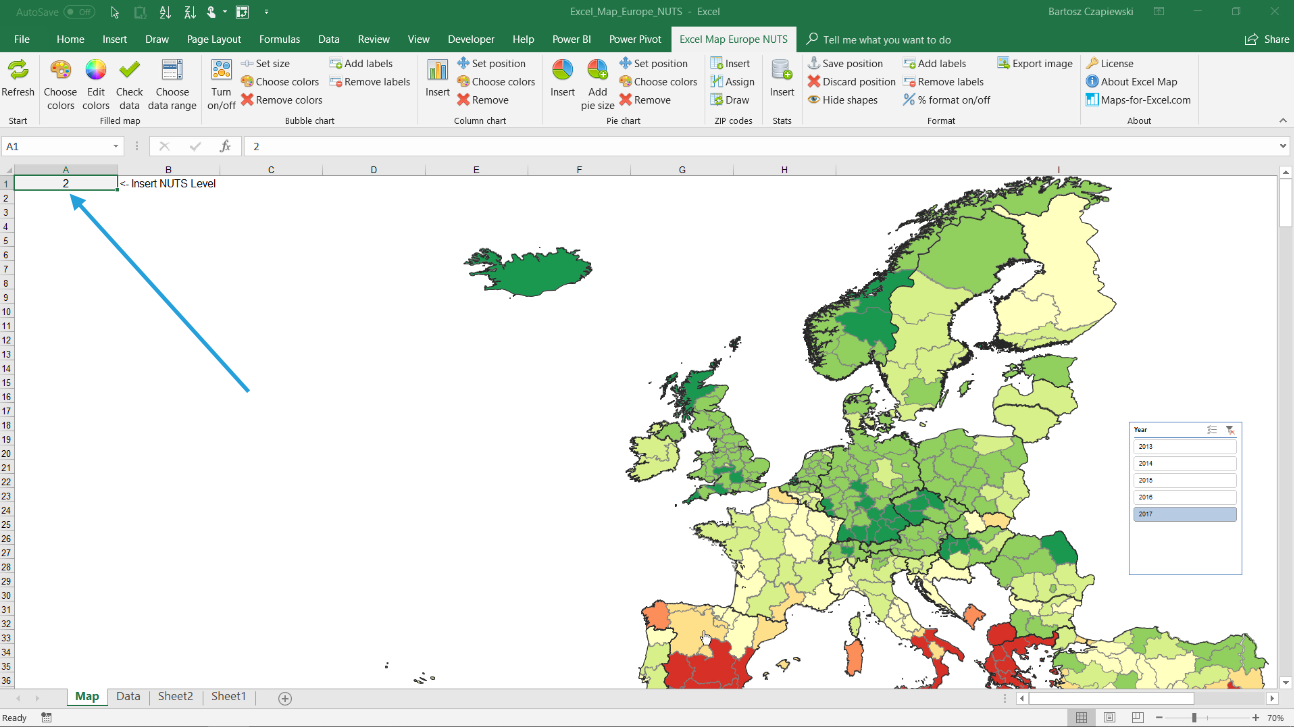
In this tutorial I’d like to present on how to use European Union statistics to create your own filled map in Excel. The tutorial is based on our Excel NUTS 0-1-2-3 Europe Map that you can find in our online shop.
Watch our video tutorial
How to create a statistics map for Europe NUTS 0-1-2-3 in Excel?
Loading the video connects your browser to YouTube. YouTube may store data on your device.
Watch on YouTube insteadStep 1: Download the data from Eurostat
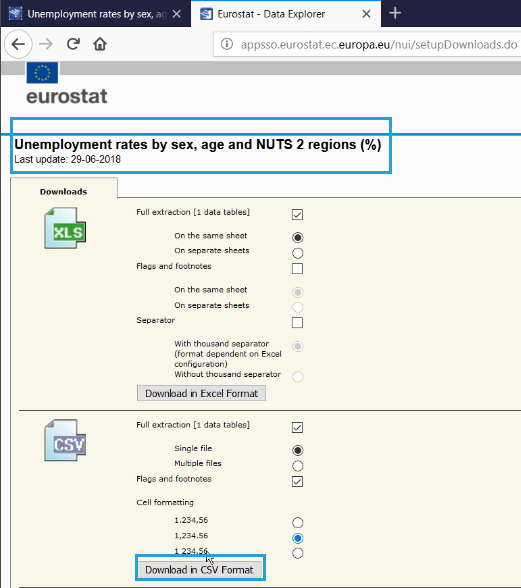
I’ve found a particular rate that I will show on the map. It is percentage unemployment rate for nuts 0 to nuts 2. I download the CSV file from Eurostat website.
Step 2: Get data with Excel Power Query
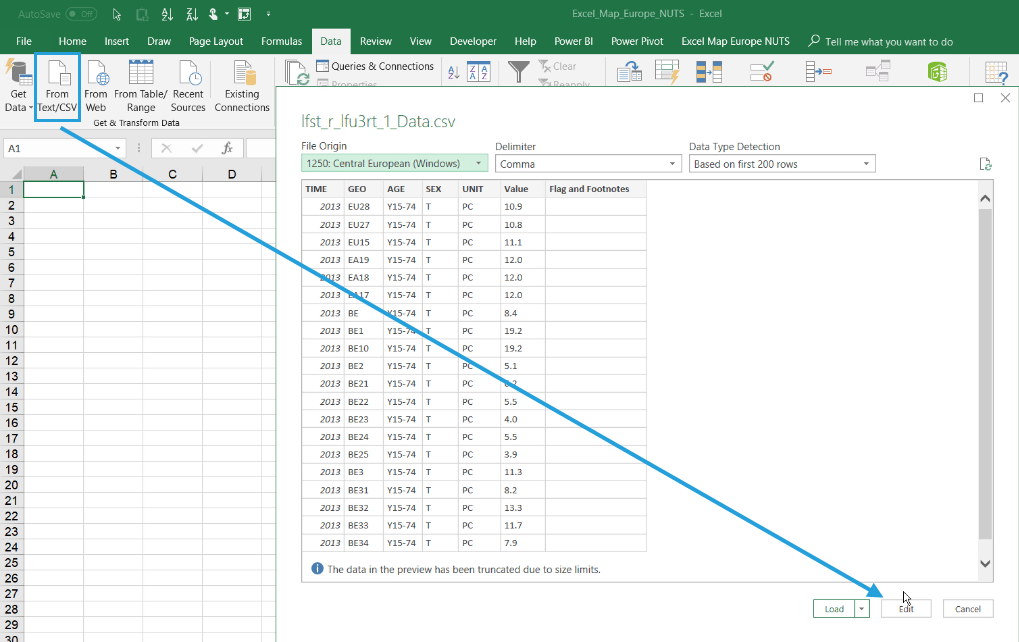
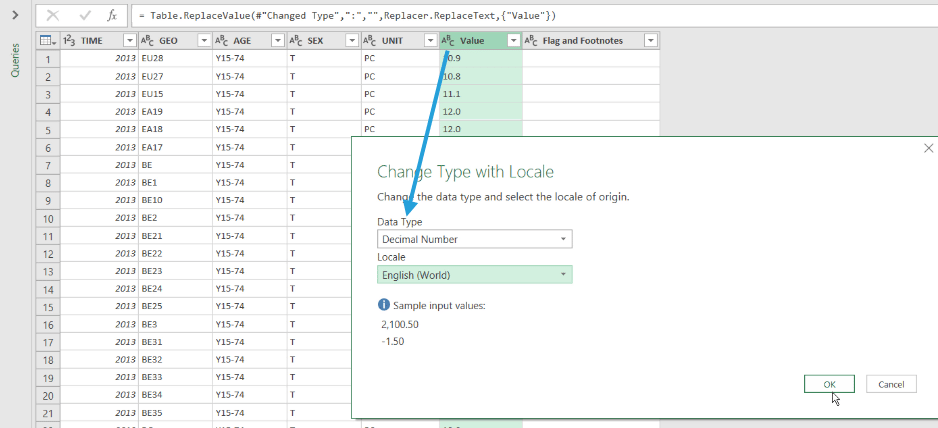
I connect to the CSV file with Excel’s most powerful tool ever called Power Query or Get and Transform. I will perform a few transforming operations to prepare the data to work in pivot tables, like applying proper decimal number data type, removing unnecessary data and deleting columns.
Step 3: Insert a pivot table
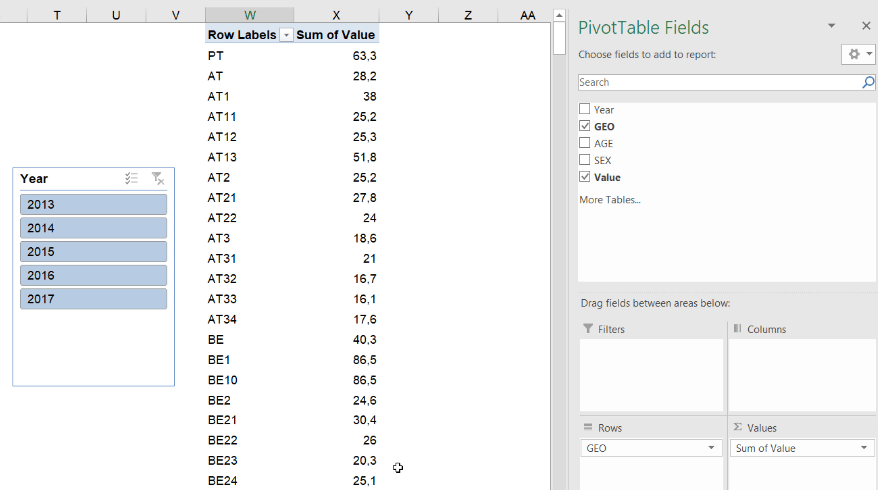
In the next step we load the data into Excel and insert a pivot table. We place Value on values shelf, GEO on rows and insert a slicer for filtering.
Step 4: Connect the Data sheet to the pivot table
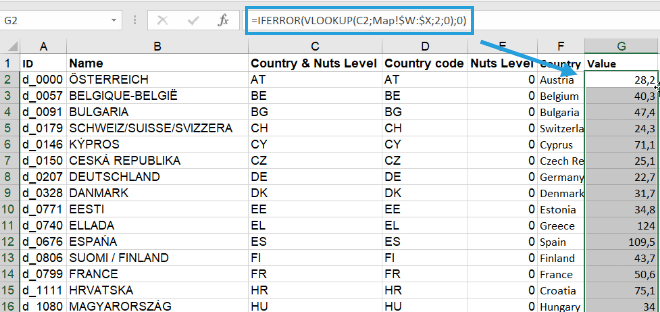
The Data sheet is responsible for coloring the map, so we need to connect the NUTS data in this sheet with our pivot table. We can use a VLOOKUP function secured by another function IFERROR. The software doesn’t allow to leave errors in the value cells.
Step 5: Create filled map legend
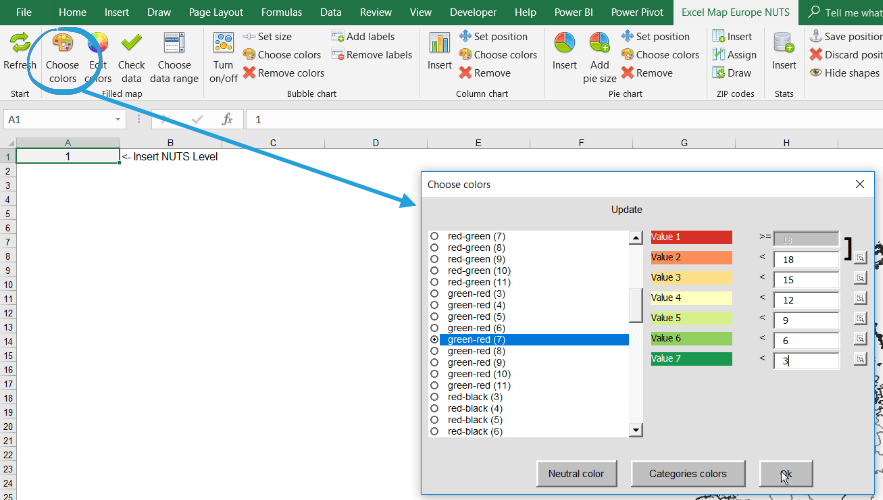
Now let’s decide on the map legend. You can create it manually or calculate it based on your data.
Step 6: Filter the data
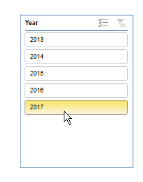
You can now use the slicer to filter the data by year.
Step 7: Change NUTS level
As the map consists of NUTS levels from 0 to 3, you can change the level you see on the map by changing the NUTS level parameter.
You can do many more with our Europe NUTS level map, so feel free to contact us.