
What is the best way to quickly compare your results on a map between consecutive years? Check the Choose data range option that allows you the quickly switch between various options.
Prepare data for different categories in the Data sheet
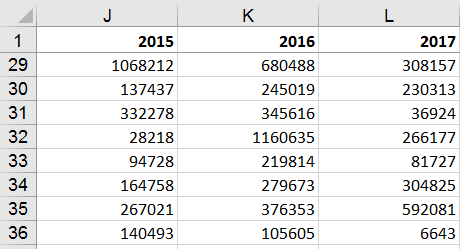
If you already have the data for all the map shapes, you can put them in the Data sheet in J:S columns diverging by e.g. the year.
Go to the data sheet and edit the headings of J:S columns:
Show data on the Map
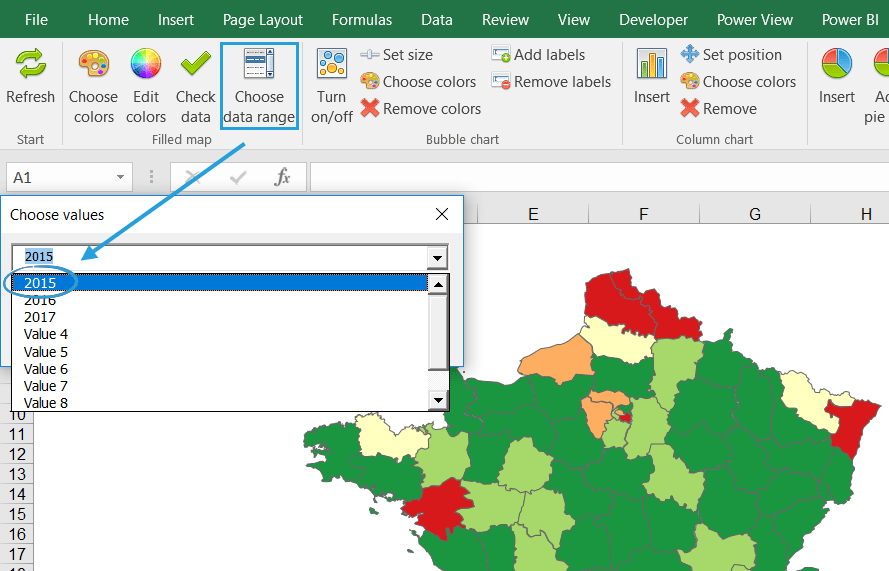
Then go to data the Map sheet and click Choose data range option on Filled map group.
Watch the video tutorial to learn how to use the Excel Map
How to compare consequtive years on the map? Choose data range for Excel Map France
Loading the video connects your browser to YouTube. YouTube may store data on your device.
Watch on YouTube instead